In the digital world, everything is reduced to an on or off state so that it can be stored in computer memory as a single bit of information: 1 or 0. Complex real world things, like images and audio, cannot be directly represented in such a simple manner. An image is rarely composed of black and white dots and audio is rarely just on or off.
Reducing images and audio to a digital state requires an analog-to-digital conversion. Instead of using just one bit of information, many bits are used to more accurately store the state. By using 2 bits, for example, four states are possible: 00, 01, 10, 11. For images, that could be black (00), dark gray (01), light gray (10), and white (11). For audio, that would give four different levels of loudness. Typically, many more bits are used. Most computer video cards use 16 to 32 bits to store a single dot. Sound cards typically use 16 bits for audio levels.
The number of bits to use depends on human perception and bit alignment within computers. Computer tend to bundle bits in groups of 8, called bytes, so using 8, 16, 24, or 32 bits would fit nicely in 1, 2, 3, or 4 bytes respectively. For images, 16 bits do not provide enough states to make the transition from one state to the next imperceptible, so 24 or more bits are used. For audio, 16 bits are adequate, which is what a CD contains, but audio systems using 24 bits will be common in the future.
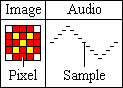
Digital audio is composed of thousands of numbers, called samples. Each sample holds the state, or amplitude (loudness), of a sound at a given instant in time. For images, each point of light, or pixel, has a certain brightness and location and all pixels combine to make a picture (see figure below). For digital audio, all the samples combine to make a waveform of the sound.
When playing audio, each sample specifies the position of the speaker at a certain time. A small number moves the speaker in and a large number moves the speaker out. This movement occurs thousands of times per second, causing vibration, which we hear as sound.
There are several attributes that determine the quality and size of a digital audio file. They are the sampling rate, the bit depth, the number of channels, and the bitrate.
The sampling rate is the number of times, per second, that the amplitude level (or state) is captured. It is measured in Hertz (seconds-1, Hz). A high sampling rate results in high quality digital sound in the same way that high resolution video shows better picture quality. Compact disks, for example, use a sampling rate of 44100Hz, whereas telephone systems use a rate of only 8000Hz. If you've ever heard music on the telephone while on hold, you'll notice a big difference in quality when compared to the original music played on a CD player.
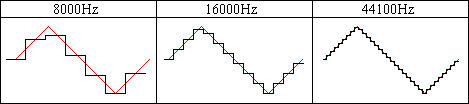
Higher sampling rates capture a wider range of frequencies and maintain a smoother waveform. The figure below shows a real world waveform in red and the digital waveform in black at different sampling rates. You can see that increasing the sampling rate makes each step of the digital waveform narrower. The shape more closely follows the real world. In general, the height of each step is reduced as well, but that depends on the number of bits. In simple terms, the sampling rate controls the width of each step.
The rate to use depends upon the type of sound and the amount of storage space available. Higher rates consume a lot of space. In the above example, the CD requires over 5 times the amount of storage as the telephone system for the same digital sound. Certain types of sounds can be recorded at lower rates without loss of quality. Some standard rates are listed in the table.
| Standard Sampling Rates | ||
|---|---|---|
| Attributes | Quality and Usage |
MB/Minute (16 bit, mono) |
| 8000Hz | Low quality. Used for telephone systems. Good for speech. Not recommended for music. | 0.960 |
| 11025Hz | Fair quality. Good for speech and AM radio recordings. | 1.323 |
| 22050Hz | Medium quality. Good for TV and FM radio quality music. | 2.646 |
| 44100Hz | High quality. Used for audio CDs. | 5.292 |
| 48000Hz | High quality. Used for digital audio tapes (DAT). | 5.760 |
| 96000Hz | Very high quality. Used for DVD audio. | 11.520 |
As explained in the Digital Audio Basics section, the number of bits determines how accurately the amplitude of the waveform is captured. The figure below shows a real world waveform in red and the corresponding digital waveforms with 2 bit samples and 3 bit samples.

You can see that adding a single bit greatly improves the way the digital waveform conforms to the real world waveform. The 2 bit waveform looks like a rough approximation with large steps. Several amplitudes are rounded to the same state, such as samples 9 through 11. This is a source of quantization noise, explained later.
In the 3 bit waveform, no amplitudes are rounded to the same state. Each step is half the height of the 2 bit waveform, but it is still not perfect. From sample 1 to sample 2, there is a jump in the waveform, which also causes quantization noise to a much lesser extent. You'll notice that samples 0 and 1 are below the real waveform and samples 2 and 3 are above the waveform. This occurs because there are no in-between states to accurately store those amplitude levels, so the digital waveform ends up straddling the real one. Therefore more states, and bits, are needed.
8 bit and 16 bit samples are common. In an 8 bit sample, there are 256 different states or levels of amplitude. 16 bit samples have 65,536 levels. This makes a huge difference it terms of sound quality. Audio stored as 8 bit samples will often have much more quantization noise.
Samples can be stored as bits a couple of different ways. One way is to consider all the states as positive, with no values below zero. As shown in the figure above, the states 00, 01, 10, and 11 are the same as the positive numbers 0, 1, 2 and 3. This eliminates the need for a negative sign. Such samples are called unsigned. For 8 bit samples, the states would range from 0 to 255.
The other way is to use a form known as two's complement, which allows both positive and negative values. These samples are called signed. Since real world waveforms tend to fluctuate through a range of positive and negative values, signed samples are preferred. For 16 bit samples, the states would range from -32678 to 32767.
When a sample is stored using more than 8 bits, more than one byte is needed. The term endian is used to describe the way bytes are ordered in computer memory. It specifies the significance of the first byte in the group. A 16 bit sample, for example, requires exactly two bytes, byte A and byte B. They can be stored as A first, then B or as B first, then A. Generally a PC will store them one way and a Mac will store them the other way due to differences in the internal processor design of those systems.
Big endian order has the most significant byte stored first, making it similar to the way we read numbers. In the number 47, the 4 is first and is most significant and the 7 is last and is least significant. This ordering is used on Mac systems.
Little endian order has the least significant byte stored first, allowing some optimizations in processing. This ordering is used on Intel and PC systems.
Digital audio can have one or more channels. Single channel audio, referred to as a monaural (or mono) audio, contains information for only one speaker and is similar to AM radio. Two channel audio, or stereo audio, contains information for two speakers, much like FM stereo. Stereo sounds can add depth, but they require twice as much storage and processing time as mono sounds. Most movie theatres have advanced audio systems with 4 or more channels, which are capable of making sounds appear to come from certain directions. Audio containing more than 2 channels are referred to as multichannel. GoldWave currently supports up to 8 channels in a 7.1 surround sound format as shown in the table.
| Channel Layout | |||||
|---|---|---|---|---|---|
| Front left (FL) | Center (C) | Front right (FR) | 3.1 | 5.1 | 7.1 |
| Low frequency effects (LFE) | |||||
| Back (5.1)/Side (7.1) left (SL) | Back (5.1)/Side (7.1) right (SR) | ||||
| Back (7.1) left (BL) | Back (7.1) right (BR) | ||||
Due to the internal structure of Wave files and the Windows default channel ordering, the "back" channels are stored before the "side" channels in 7.1 surround sound. Therefore GoldWave refers to the 5.1 surround channels as "back" channels and displays the 7.1 "side" channels below the "back" channels.
Since digital audio is limited by the sampling rate, the number of bits, and the number of channels, a digital waveform can never be an exact replica of the real world waveform. These limitations can lead to a number of problems, such as aliasing, clipping, and quantization noise.
Aliasing occurs when the sampling rate is not high enough to correctly capture the shape of the sound wave. The recorded sound will have missing tones (Figure: Aliasing, top) or new tones that never existed in the original sound (Figure: Aliasing, bottom). These problem can be eliminated by using higher sampling rates or by using anti-aliasing filters.
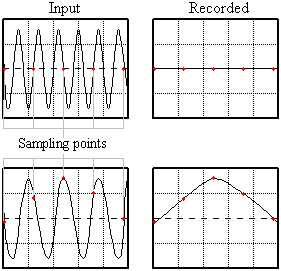
Higher sampling rates increase the number of sampling points. To see how this works, try adding a three points between each sampling point in the figure and redraw the graph. The recorded sound will more closely resemble the input.
Anti-aliasing filters remove all tones that cannot be sampled correctly. They prevent high pitched tones from being aliased to low pitch. Many sound cards include anti-aliasing filters in hardware.
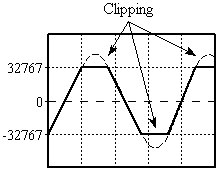
Clipping errors occur when the level is too high to be stored in the bits available. For example, if the maximum level for a 16 bit sample is 32767, and the actual level is 40000, then it must be clipped to 32767 to fit (see the figure). This generates distortion. To eliminate clipping, adjust the recording volume before recording. By using the Control window's Monitor input on visuals feature, you can adjust the volume to a suitable level. The volume is low enough when the VU Meter visual does not reach the top of the red region.
Clipping can occur when processing effects, such as increasing the volume with the Change Volume effect. GoldWave does not clip audio internally, but it has to be clipped when sending the audio to the sound card or when saving a file. You should use the Maximize Volume effect with a 0dB setting before saving to ensure that no clipping occurs in the file.
The real world has an infinite number of states, but the digital world has a very limited number of states. Quantizing is process of assigning an amplitude to this limited quantity of states. Quantization noise occurs when an amplitude is rounded to the nearest state for the given number of bits. This is illustrated in the Bits section. Using 2 bits causes large rounding errors and only roughly follows the real waveform. Using 3 bits has much smaller rounding errors, but is still nowhere near as smooth as the real world waveform. Using 8 bits gives a much smoother waveform, but the round errors can still be heard. Using 16 bits gives errors so small that they are almost imperceptible.
To minimize internal and external noises, make sure your sound card is installed as far away from your graphics card as possible. If the sound hardware is integrated into the computer's main board, consider purchasing and installing a separate sound card instead. Integrated hardware tends to have a much higher noise level.
Keep all microphones and audio cables away from your monitor, computer case, or other sources of electrical noise. Use shielded cables and make sure everything has a common ground connection. Plug equipment and devices into the same power strip so that they share the same ground. Equipment without a grounded plug (three pronged plug) may require special grounding. Sometimes rotating the plug helps reduce a hum or buzz.
System configuration can also affect audio quality. Due to architectural problems with PCs and excessive virtual memory swapping by Windows, you may notice an occasional gap when recording. Restarting Windows, updating the sound driver, shutting down all other programs, or installing more memory (RAM) helps to minimize that problem.
The waveform levels or states can be interpreted in a number of different ways. Reading the states in their binary form is impractical, so the states are mapped to different scales that are more human-readable. These include a simple amplitude scale, a percentage scale, and a decibel scale. As the figure shows, a 1.0 amplitude level is the same as a 100% level and a 0dB level.
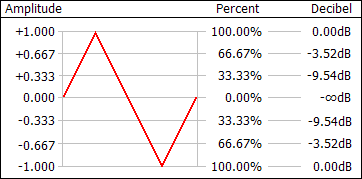
The amplitude scale simply maps the states to a linear range of -1.0 to +1.0, with zero being silence. The amplitude typically is given as a positive value when used in effects.
The percent scale is 100% at the maximum and 0% at silence. It is essential the same as the absolute value of the amplitude scale converted to a percentage by multiplying by one hundred and adding a percent sign. Sometimes a negative percentage is used, such as in the Flanger effect, to invert the waveform.
The decibel scale (specifically dBFS) is unusual in that it is 0dB at the maximum peak level and negative infinity at silence. It is a logarithmic scale, which is closer to the way human hearing perceives sound levels. You'll notice from the above figure that there are no positive levels. Levels below the maximum are negative. Only values above the maximum are positive (not shown) and such values may cause clipping. When changing the volume, positive values increase the level and negative values decrease the level.
Levels shown in most visuals are dBFS and not dBSPL.
Use the equation below to convert a decibel level to a percentage level.
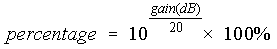
When setting the volume in an effect, the value may be interpreted as a relative level or an absolute level. When changing the volume, it is usually relative. When specifying a threshold, it is usually absolute. Relative changes are cumulative. So if you apply a volume change with 0.5 amplitude (50% or -6.02dB), then the amplitude decreases to half its current level. If you apply that change again, then it decreases to one quarter of its original level. In other words, the change is relative to its current level. Given an original amplitude of A, the first change yields a result of A x 0.5 and the sample is replaced by that value. The second change takes that value and multiplies it by 0.5 again, so we get the final result of (A x 0.5) x 0.5 or A x 0.25. Most of the effect settings in GoldWave are cumulative. For relative changes, using 1.0, 100%, or 0dB does not alter the sound at all.
Absolute levels are user for thresholds, such as in Silence Reduction, or in rare cases were the absolute level is set directly, such as Maximize Volume. Absolute changes are not cumulative. If you maximize the sound with 0.5 amplitude (50% or -6.02dB), then that is what the peak level will be no matter how many times the effect is used. For absolute changes, using 1.0, 100%, or 0dB may alter the sound if it is not currently at that level.
Sound windows in GoldWave show sound as a waveform of amplitudes on a time axis. However, sound can be viewed in an entirely different way by examining its frequency and pitch content or frequency spectrum. Sounds are broken down into a combination of simple fundamental (sinusoidal) tones, each with a different frequency. This is useful for examining bass and treble levels or for isolating and studying certain sounds.
Average human hearing spans a frequency range from about 20Hz to about 17000Hz. The figure below shows some common sounds and the frequency range they cover.
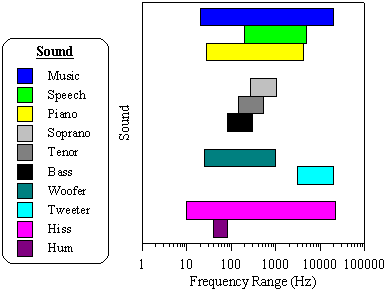
Many people wonder why it is difficult to remove vocals from music. From the figure, you'll see there is a large overlap in the frequency range of speech and music. Removing the vocals would also remove a significant part of the music. A similar problem occurs when removing hiss noise, since it often covers the entire spectrum.
Most basic stereo systems have bass and treble controls, which offer limited control over a frequency spectrum. Bass applies to low frequency sounds, such as drums, cellos, low piano notes, or a hum noise. Treble applies to high frequency sounds, such as a clash of cymbals, a tweet of a small bird, high notes on a piano, or a hiss noise.
More expensive stereo systems have Graphic Equalizers, which provide better control over a frequency spectrum. Instead of controlling just two bands (bass and treble), you can control many bands.
GoldWave provides even more control over frequency spectrums with filter effects such as Parametric EQ, Low/Highpass, Bandpass/stop, Equalizer, Noise Reduction, and Spectrum Filter.
The frequency range of a digital sound is limited by its sampling rate. In other words, a sound sampled at 8000Hz cannot record frequencies above 8000Hz. In fact, the sound cannot even have frequencies above 4000Hz. According to the sampling theorem, the maximum frequency is limited to half the sampling rate. Any higher frequencies will be aliased, to lower ones, causing noise if appropriate filters are not used.
CD audio is designed to cover the full range of human hearing, which has a maximum of under 22kHz. In order to successfully record this range, the sampling theorem states that a sampling rate of at least twice the maximum must be used, so a rate of at least 44kHz is required. The actual rate is 44100Hz for standard CD players.
Several of GoldWave's Control visuals convert sounds into a range of frequency bands using a radix-2 fast Fourier transform (FFT) algorithm. When the results are drawn using colours, the graph is referred to as a spectrogram. When the results are drawn with lines, it is often referred to as a frequency spectrum or frequency analysis.
Frequency analysis graphs are displayed in the Noise Reduction, Spectrum Filter, and Parametric EQ filter effects. These help you to locate frequencies that you want to remove or enhance.
GoldWave applies a windowing function to the data before performing the FFT (see Control Visual Properties section). This reduces "discontinuity" errors that occur when dividing data into small chunks. A Kaiser window is used by default.
To make the spectrum more realistic to human hearing, magnitudes are scaled logarithmically. This means that if one frequency "sounds" twice as loud as another, it is graphed with twice the height (or the corresponding colour for the spectrogram).
File compression (not to be confused with amplitude compression) makes files smaller using a variety of algorithms. Uncompressed audio files tend to be large. CD quality audio requires ten megabytes per minute. That is not a problem with large computer hard drives available today, but it is a problem if you want to save many songs on a portable player or if you want to transfer files over the Internet. Unlike most computer data, audio data does not compress very well using typical compression methods such as those found in programs like PKZIP or WinZip. These methods preserve the data exactly so there is no loss of quality. Such compression is called lossless compression.
To make audio files smaller, complex algorithms have to used. Most of these algorithms sacrifice some quality so that when the data is decompressed, you do not get exactly the same quality you had originally. This type of compression is known as lossy compression. Ideally the quality that is lost is not perceptible, so you do not notice the difference.
The most common method of lossy audio compression is MPEG Layer-3, better known as MP3. It is capable of getting near CD quality audio in less than one tenth the size, which is about one megabyte per minute. Other algorithms, such as AAC, Ogg Vorbis, and Windows Media Audio get even better quality in a smaller size.
Software and hardware that compress audio using complex algorithms are referred to as codecs (from coder/decoder). Compression is the same as encoding and decompression is the same as decoding.
To control the level of compression in GoldWave, use File | Save As and select a different file type and/or attributes. The lower the bitrate (the kbps number, see below), the smaller the file will be, usually at reduced quality.
When opening, editing, and saving a file repeatedly, it is best to use a lossless file format. Every time a lossy compressed file is re-opened and saved, some quality is lost. For long term editing, use the Wave type with "PCM 16 bit" attributes or one of the lossless compressed formats such as FLAC or Windows Media Audio with "lossless" attributes.
Many compressed audio formats measure the compressed size as a bitrate. The bitrate is the number of bits per second (bps) required to store the audio. Usually the number is given in kilobits or one thousand bits. Divide that number by 8 to determine the number of kilobytes required per second.
Internet connection speed (bandwidth) is often measured in bitrates as well. A 56k modem is capable of receiving 56 kilobits per second. If you want people to stream your MP3 audio over a modem, you'll need to compress the file using a maximum bitrate of 56kbps. Due to the connection overhead and Internet protocol, a lower rate would have to be used to ensure the audio can be downloaded fast enough. For DSL and Cable Internet connections, the standard 128kbps MP3 rate can be used.
Audio files can contain a wide range of sounds, from noisy cymbal clashes to silence. Algorithms typically get much better compression on silence or simple audio sections than on complex, noisy audio. This means that the bitrate depending on whether constant bitrate or variable bitrate compression is used.
When using constant bitrate, each section of audio compresses to exactly the same size, regardless of the content. If the audio contains silence, then the data may be padded to fill the required bitrate. If the audio contains complex music, then quality may be decreased until it fits within the bitrate.
Constant bitrate is useful for broadcast systems where the transmission rate is fixed. It also make is easy to seek to arbitrary positions within the audio stream or file.
Variable bitrate compression uses the smallest size possible for each section of audio. If the audio contains silence, then the bitrate will be very low. If the audio contains complex music, the bitrate will be at its maximum.
Variable bitrate gives the best compression and quality. However, it makes it difficult to seek within the stream or file since there is no direct relation between time and size.